Foreclosures In St Louis During First Half of 2016 Down Over 27 Percent From Prior Period

There were 4,935 foreclosure filings on homes in the St Louis metro area during the first six months of 2016, a decline of 27.1% from the second half of 2015 when there were 6,770 foreclosure filings and down 9.75% from the first half of 2015 when there were 5,468 filings, according to a report just released by RealtyTrac.

As the table below shows, for the first half of 2016, foreclosures decreased in 13 of 15 counties in the St Louis area from the 2nd half of 2015 and 10 declined from the same period a year ago.

(We work hard on this and sure would appreciate a “Like”)

Search St Louis Foreclosures For Sale HERE

Search St Louis Homes For Sale HERE Continue reading “Foreclosures In St Louis During First Half of 2016 Down Over 27 Percent From Prior Period

St Louis Foreclosure Activity Declines Nearly Ten Percent in May From Year Ago

Foreclosure activity in the St Louis metro area during the month May occurred at a rate of 1 foreclosure action for every 1,267 homes, an increase of 20.3 percent from the month before, but a decrease of 9.75% from a year ago, according to a report just released today by RealtyTrac.


As the table below illustrates, 5 of the seven Missouri counties, and 2 of the eight Illinois counties, saw a decline in foreclosure activity in May from the year before, and 1 Missouri county, and 3 Illinois counties, saw a decline from the month before. Of the fifteen counties reported, only 3 saw a decline in foreclosure activity in May both from the month before, as well as year before, those being the City of St Louis in Missouri and Jersey and Monroe counties in Illinois.


(We work hard on this and sure would appreciate a “Like”)

Search St Louis Foreclosures For Sale HERE

Search St Louis Homes For Sale HERE Continue reading “St Louis Foreclosure Activity Declines Nearly Ten Percent in May From Year Ago

Down payment Assistance Programs Cover All of Buyers Downpayment In Most St Louis Areas

There are a variety of down payment assistance providers in the St Louis area where a qualifying home buyer can obtain assistance with their downpayment to buy a home. According to a report just released today by RealtyTrac, the average amount of down payment assistance covers the typical down payment on a median priced home in 4 out of five of the St Louis Counties that make up the core market, with St Charles County being the only exception. As the table below shows, in St Charles County the average down payment assistance of $5,000 falls short of the typical downpayment on a median priced home of $6,150 but still covers most of it. In the other 4 counties the down payment is more than covered.

(We work hard on this and sure would appreciate a “Like”)

Search St Louis Homes For Sale HERE
See ALL Homes That Will Be Open In St Louis This Weekend
Information On Down Payment Assistance Programs Available In Missouri
Get a Market Report with LIVE up to date Home Sales, Prices and Inventory for ANY St Louis Area HERE

Continue reading “Down payment Assistance Programs Cover All of Buyers Downpayment In Most St Louis Areas

Home Flipping in St Louis Declines In 1st Quarter From Year Ago

Home flipping accounted for 8.1 percent of all the home sales in the St Louis MSA during the 1st quarter of this year according to a report released today by RealtyTrac. This is up 20 percent from the prior quarter however is a decline from the first quarter of 2015 when flipped homes accounted for 8.3% of all the homes sold.

Home flipping in St Louis peaked in 2006…

During the first quarter of 2016, over 1 out of every ten home sales (10.7%) in St Louis was a flip, the highest level ever seen in St Louis since RealtyTrac began tracking flips.

(We work hard on this and sure would appreciate a “Like”)

Search St Louis Homes For Sale HERE
See ALL Homes That Will Be Open In St Louis This Weekend
Want to flip property? Check out my video on how to buy foreclosures here.
Continue reading “Home Flipping in St Louis Declines In 1st Quarter From Year Ago

St Louis Foreclosures Decline Over Thirty Percent In April From Year Before

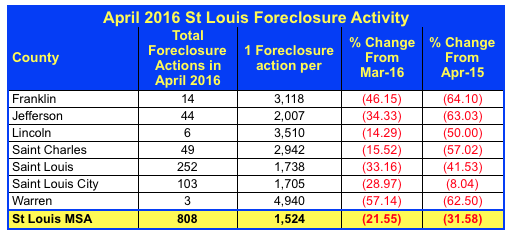
St Louis foreclosure activity during the month of April decreased to 1 foreclosure action for every 1,524 homes, a decline of 31.58 percent from April 2015, according to a report just released by RealtyTrac.


As the table below illustrates, foreclosure activity during the month of April decreased from the month before, as well as the year before, in all seven Missouri counties that make up the bulk of the St Louis market.

(We work hard on this and sure would appreciate a “Like”)

Search St Louis Foreclosures For Sale HERE

Search St Louis Homes For Sale HERE

St Louis Foreclosure Activity April 2016

Home Mortgage Loan Originations Decline In First Quarter Of 2016

Home mortgage loan originations in the St Louis metro area declined during the first quarter of this year to 5,843 total loan originations for purchase mortgages, a decline of 16 percent from the prior quarter when there were 6,976 purchase mortgage loan originations, according to the latest data from RealtyTrac.

More homeowners refinancing than buying…

During the first quarter of 2016, 7,710 homeowners in the St Louis metro area refinanced their home mortgage, down 3 percent from the prior quarter when 7,956 homeowners refinanced. Refinancing accounted for 57% of the loan originations in the St Louis area during the first quarter of 2016 up from 53% during the prior quarter.

(We work hard on this and sure would appreciate a “Like”)

Search St Louis Homes For Sale HERE
See ALL Homes That Will Be Open In St Louis This Weekend
Find out how much you can save refinancing your home loan – click here for Dennis’s recommendation of a great lender in your area.
 

St Louis Foreclosure Activity Down In Most Areas

St Louis foreclosure activity during the first quarter of this year in the St Louis metro area was at a rate of 1 of every 469 homes, ranking St Louis 99th, in terms of foreclosure rate (a list that is good to be low on), of metropolitan areas in the U.S. with a population in excess of 200,000 people, according to a report just released by RealtyTrac. The foreclosure rate in St Louis during the 1st quarter of 2016 declined 10.55 percent from the quarter before and declined 13.67 percent from the first quarter of 2015.

As the table below illustrates, foreclosure activity in all but two of the counties in Missouri that make up the St Louis MSA saw a decline in foreclosure activity from the prior quarter and all, but the city of St Louis, saw a decline from a year ago.


(We work hard on this and sure would appreciate a “Like”)

Search St Louis Foreclosures For Sale HERE

Search St Louis Homes For Sale HERE

Continue reading “St Louis Foreclosure Activity Down In Most Areas

Report Shows Relationship Between Registered Criminal Offenders And Home Prices

This morning RealtyTrac released a report identifying neighborhoods with higher rates of registered criminal offenders (including sex offenders, child predators, kidnappers and violent offenders) and then comparing the housing statistics for those neighborhoods to ones with lower rates of registered criminal offenders. For the report, cities were given an index, from 0 to 100, with a higher value indicating a higher percentage of offenders, then these cities were sorted into five categories, based upon their index, from Very High Offender Rate to Very Low Offender rate.

The findings from this report are below:

  • Cities in the U.S. at the top of the Very High offender index were Greenville, South Carolina (73 percent); Columbia, South Carolina (66 percent); Boise, Idaho (66 percent); Pensacola, Florida (60 percent); and Flint, Michigan (57 percent).
  • Cities in the U.S. where more than one-fourth of all homes were in zip codes with a Very High offender index included Detroit (39 percent), Nashville (32 percent), San Antonio (31 percent), St. Louis (31 percent), and Tampa (26 percent).
  • Cities at the top of the Very Low offender index were Minneapolis-St. Paul (90 percent); Portland, Oregon (88 percent); Trenton, New Jersey (62 percent); New York (61 percent); and Boston (52 percent).
  • The higher the offender index, the lower the home value and amount of equity:
    • The average home value in zip codes with a Very Low offender index is $512,841, more than three times higher than home values in zip codes with a Very High offender index which have an average value of $157,844.
    • The average home owner in zip codes with a Very Low offender index has 29 percent equity, nearly three times the average equity of just 10 percent for homeowners living in zip codes with a Very High offender index.

(We work hard on this and sure would appreciate a “Like”)

Search St Louis Homes For Sale HERE
See ALL Homes That Will Be Open In St Louis This Weekend
St Louis Market Data (Home Prices, Sales, Trends and MORE) By City, Zip or County
Continue reading “Report Shows Relationship Between Registered Criminal Offenders And Home Prices

House Flipping Activity In St Louis Last Year Same As Year Before

Flipping houses, something that went from something a few professional speculators only did years ago when I was actively buying homes for resale, became somewhat of a national pastime during the real estate boom years in the 2000 – 2007 period. House flipping in St Louis, while being done less than 10 years ago at nearly the peak of the bubble market, is still alive and well in St Louis. As the table below shows, during 2015 there were 2,386 homes flipped in the St Louis metro area, just about the same exact number as there were in 2014.

For the purposes of this article, a property that is sold, in an arms-length sale, for the second time within a 12-month period is considered a home flip.

St Charles County saw decline in house flipping…

As the data below illustrates, St Charles county was the only county in the St Louis core market that saw a decline in house flipping during 2015 from the year before and Franklin county saw the largest increase.

Gross profit on flips..

The second table down, shows the median gross profit, as well as return on investment (ROI) for house flips during 2015 by county.

(We work hard on this and sure would appreciate a “Like”)

Search St Louis Homes For Sale HERE
See ALL Homes That Will Be Open In St Louis This Weekend
Want to flip property? Check out my video on how to buy foreclosures here.
Continue reading “House Flipping Activity In St Louis Last Year Same As Year Before

St Louis Foreclosure Activity In January Declines Over Twenty Five Percent From Year Ago

St Louis foreclosure activity in January was at the rate of 1 in every 1,533 households, which is down almost 16 percent from December and down over 25 percent (25.79%) from a year ago, according to the latest data from RealtyTrac. As the table below shows, the county in the St Louis MSA with the lowest foreclosure rate in January 2016 was Calhoun County Illinois, with no foreclosure activity for the month, and the county with the highest rate was St Clair County Illinois with 1 of every 1,223 housing units having foreclosure activity during the month. St Louis County had the highest foreclosure rate of the Missouri counties within the St Louis MSA, with one in every 1,386 housing units having a foreclosure activity.

(We work hard on this and sure would appreciate a “Like”)

Search St Louis Foreclosures For Sale HERE

Search St Louis Homes For Sale HERE

Continue reading “St Louis Foreclosure Activity In January Declines Over Twenty Five Percent From Year Ago

City of St Louis Property Vacancy Rate Over Four Times Higher Then National Rate

According to a report just released this morning by RealtyTrac, 6,809, of the 103,855 residential properties in the city of St Louis, are vacant. This vacant property rate of 6.6 percent for the City of St Louis is over four times higher than the national rate of 1.6 percent. As the table below shows, the vacant property rate for the St Louis MSA as a whole is 2.6 percent and St Louis County has the second highest vacancy rate, coming in a 2.6 percent. St Charles County has the lowest vacancy rate at 0.4 percent.

“Abandoned ship” properties…

I’m applying the label of “abandoned ship properties” to those properties that are sinking, or seriously underwater with regard to equity, otherwise known as being in a negative-equity position, and are vacant as well. In this category, are 1,390 properties in St Louis county or, nearly 15 percent (14.8%) of all of the vacant properties in the county. For the MSA as a whole, 9.7% of all vacant properties are “abandoned shop” properties.

(We work hard on this and sure would appreciate a “Like”)

Search St Louis Homes For Sale HERE
See ALL Homes That Will Be Open In St Louis This Weekend
St Louis Market Data (Home Prices, Sales, Trends and MORE) By City, Zip or County
Continue reading “City of St Louis Property Vacancy Rate Over Four Times Higher Then National Rate

St Louis Foreclosure Activity During 2015 Tops 2014 By Nearly Forty Percent

During 2015, a total of 10,391 housing units, or 1 out of 118 units, in the St Louis MSA had a foreclosure filing, according to a report just released by RealtyTrac. This is an increase of 38.29% in foreclosure activity from 2014.

As the table below shows, Jefferson County had the highest rate of foreclosure in 2015 with 1 of every 114 housing units receiving a foreclosure action during the year and Warren County the lowest with just 1 of every 278 housing units receiving a foreclosure filing.

(We work hard on this and sure would appreciate a “Like”)

Search St Louis Foreclosures For Sale HERE

Search St Louis Homes For Sale HERE

Continue reading “St Louis Foreclosure Activity During 2015 Tops 2014 By Nearly Forty Percent

St Louis Millennials Are Moving To The City and Their Parents Are Moving Out

I have the honor of serving as chairman of the St Louis Industry Forum which consists of leaders of professional and trade associations that are engaged in some aspect of the real estate industry in St Louis (such as REALTORS, Builders, Mortgage Lenders, Bankers, etc) and at our bi-monthly meetings millennial’s are often the topic of conversation with regard to this generations thoughts on home ownership vs. renting, where they want to live and other related matters. It’s no surprise our industry would be so focused on the millennial generation since this group of teens to 30-something year-olds represents the largest generation (and group of future homeowners or tenants) we have seen.

In other articles I have addressed the issue of homeownership by the millennial generation so in this one I am instead going to look at where the millennials are moving. I prepared the table below which shows all of the major counties in the MSA’s in Missouri, home affordability in those areas as well as the change in population with regard to the millennial generation as well as their parents generation, the baby boomers.

Millennials are heading to the city of St Louis…

(We work hard on this and sure would appreciate a “Like”)

Search St Louis Homes For Sale HERE
See ALL Homes That Will Be Open In St Louis This Weekend
Chart Showing St Louis Home Prices Versus St Louis Rents
Continue reading “St Louis Millennials Are Moving To The City and Their Parents Are Moving Out

Is It More Affordable To Buy Or Rent In St Louis?

When trying to decide whether to buy a home or condo instead of continuing to rent, many would-be first-time home buyers compare the cost of buying a home or condo versus renting something similar. Granted, there are other benefits that come with ownership (along with some additional responsibilities and risks, of course) including potential return on the investment, stability, etc but, if the first thing often considered is the cost of a house payment versus rent…if difference is too large and, therefore, the sacrifice to buy is too great, the consideration of buying often ends at that point.

Is it more affordable to rent or buy a home in the St Louis area?

RealtyTrac just released a report this morning analyzing the cost of buying a home versus renting a home throughout the United States and found that buying a home is still more affordable than renting of 58 percent of U.S. housing markets in spite of the fact that home prices are rising at a greater percentage than rents in 55 percent of the markets analyzed.

Here is St Louis, of the 5 main counties that make up our market, as the table below shows, it is actually more affordable to buy a home in 3 of the five counties:

(We work hard on this and sure would appreciate a “Like”)

Search St Louis Homes For Sale HERE
See ALL Homes That Will Be Open In St Louis This Weekend
Chart Showing St Louis Home Prices Versus St Louis Rents
Continue reading “Is It More Affordable To Buy Or Rent In St Louis?

St Louis Foreclosure Activity In November Increased Over 60 Percent From Year Ago

St Louis Foreclosure activity increased in November to 1 foreclosure activity on 1 of every 1,086 housing units in the St Louis MSA, a decrease of 8.06 percent from the month before but an increase of 62.59 percent from November 2014, according to a report just released by RealtyTrac.


St Louis 5-County Core Market…

As the table below shows, all of the 5 counties that make up the St Louis core market (St Louis city and the counties of St Louis, St Charles, Jefferson and Franklin), with the exception of Jefferson, saw a decline in foreclosures from October 2015. However, like the St Louis metro area as a whole, they all had increased activity from the year before with three of the counties (St Louis city and St Louis and St Charles County) seeing a triple digit increase and Jefferson and Franklin double digit increases.


(We work hard on this and sure would appreciate a “Like”)

Search St Louis Foreclosures For Sale HERE

Search St Louis Homes For Sale HERE

Continue reading “St Louis Foreclosure Activity In November Increased Over 60 Percent From Year Ago

St Louis Metro Area Distressed Home Sales Share Of Market Drops By Nearly Half From Year Ago

Distressed home sales in St Louis during the month of October 2015 accounted for about 11.6 percent of all home sales during the month, a decline of about 50 percent from a year ago when St Louis distressed home sales accounted for 23 percent of the all home sales, according to the latest data just released by RealtyTrac. Distressed home sales would include foreclosures, REO’s (homes that have been foreclosed upon and now being sold by a bank or other lender) and short sales.

As the table below shows, the St Louis metro area saw a decline in all types of distressed home sales in October from the month before, however some of the counties in the area saw an increase such as the city of St Louis that saw distressed home sales increase from 20.9% in September 2015 to 25.3% in October.

(We work hard on this and sure would appreciate a “Like”)

Search St Louis Foreclosures For Sale HERE

Search St Louis Homes For Sale HERE

Continue reading “St Louis Metro Area Distressed Home Sales Share Of Market Drops By Nearly Half From Year Ago

St Louis County Tied For Top Missouri County For Affordable Homes And Good Elementary Schools

St Louis County has 6 Elementary Schools that have tested at least 50% higher on standardized tests than the average for the state of Missouri and are located in neighborhoods where home prices are affordable, according to a report just released by RealtyTrac. According to the report, these 6 good elementary schools are surrounded by homes that with house payments that will take less than 30% of the families monthly wages to buy, making them very affordable. In fact, for McKelvey Elementary, in Maryland Heights, the average family will need to spend less than 18% on a house payment to live near by.

The table below shows good schools in affordable neighborhoods throughout the state. As you can see, Jackson County (Kansas City) tied St Louis county with 6 good elementary schools in affordable neighborhoods and St Charles County came in third with 4.

(We work hard on this and sure would appreciate a “Like”)

Search St Louis Homes For Sale HERE
See ALL Homes That Will Be Open In St Louis This Weekend
5 Key Strategies To Assure A Quick Home Sale At The Maximum Price
Continue reading “St Louis County Tied For Top Missouri County For Affordable Homes And Good Elementary Schools

Foreclosure Activity Trending Upward In St Louis Metro Area But Not In St Charles

Foreclosure activity, after an extended downward trend, has trended upward lately in the St Louis metro area and October was no exception seeing an increase of over 13 percent (13.17%) in activity from the month before and, on a 12-month rolling average, an increase of almost 30 percent (29.85%) from a year ago, according to the latest data from RealtyTrac.

St Charles County bucks the trend…

The table below shows foreclosure activity for the 15 major counties that make up the St Louis MSA, 7 of which are in Missouri and the other 8 in Illinois and, as the table reveals, St Charles County is bucking the trend and, even though foreclosure activity there rose 14.85 percent from the month before, it was down over 80 percent from a year ago and the 12-month rolling average was down 18.48 percent from a year ago.

(We work hard on this and sure would appreciate a “Like”)

Search St Louis Foreclosures For Sale HERE

Search St Louis Homes For Sale HERE

Continue reading “Foreclosure Activity Trending Upward In St Louis Metro Area But Not In St Charles

One In Four Home Sales In St Louis Is Financed With FHA Loan- Same Number For Cash Sales

Nearly one in every 4 home sales in St Louis (23.9%) during the 3rd quarter of 2015 were financing with an FHA loan, according to data just released by RealtyTrac. This is a slight decrease from the quarter before when 24.3% of the homes sold were financed with an FHA loan, but is an increase of 30% from a year ago when FHA financing was used on just 17.45 of the homes purchased in St Louis.

FHA financing has more lenient credit requirements, as well as a required downpayment of just 3.5 percent of the sales price, making home financing available to home buyers that cannot meet the more stringent credit and/or downpayment requirements of conventional financing.

At the other end of the spectrum….

As the table below shows, nearly one in four (24.2%) of the homes sold in St. Louis during the quarter were cash sales. Like FHA financing, cash sales’ share of the market dropped slightly during the 3rd quarter of 2015 from the quarter before but increased 32.6% from a year ago.

(We work hard on this and sure would appreciate a “Like”)

Search St Louis Homes For Sale HERE
See ALL Homes That Will Be Open In St Louis This Weekend
5 Key Strategies To Assure A Quick Home Sale At The Maximum Price

Fha and Cash Sales St Louis

Data Source: RealtyTrac Copyright 2015 St Louis Real Estate News

St Louis Foreclosures Spike During 3rd Quarter

St Louis Foreclosures spiked during the 3rd quarter of this year with all of the counties in Missouri that are in the St Louis MSA seeing an increase of double digits in foreclosure activity from a year ago, according to a report just released by RealtyTrac.

Below is a table showing foreclosure data for all of the counties that make up the St Louis metro area on the Missouri side of the Mississippi revealing that St Charles County saw the greatest increase in foreclosure activity from a year ago with a 283 percent increase during 3rd quarter 2015 from 3rd quarter 2014.

(We work hard on this and sure would appreciate a “Like”)

Search St Louis Foreclosures For Sale HERE

Search St Louis Homes For Sale HERE

Continue reading “St Louis Foreclosures Spike During 3rd Quarter

The Number of Zombies In St Louis Triples In Past Year

No, in spite of the fact this is October, this article is not about Halloween nor the zombies associated with it, instead, it’s about vacant homes that have delinquent mortgages but have not yet been foreclosed upon yet, which the industry has applied the term of “zombie” to. According to a report just released by RealtyTrac, the number of Zombie foreclosures in St Louis county nearly tripled in the 3rd quarter of this year compared with the 3rd quarter of last year. As the table below shows, the city of St Louis also saw a large increase.

The second table shows the number of properties that are vacant (but not necessarily in default on mortgages) and reveals that about 1 out of every 13 homes in the city of St Louis were vacant during the 3rd quarter of this year.

(We work hard on this and sure would appreciate a “Like”)

Search St Louis Foreclosures For Sale HERE

Search St Louis Homes For Sale HERE

Continue reading “The Number of Zombies In St Louis Triples In Past Year

St Louis Distressed Home Sales Share Of Home Sale Market Declines Over 50 Percent

St Louis distressed home sales share of the St Louis real estate market continues to decline minimizing the negative effect on home prices caused by distressed home sales. In August, distressed home sales, primarily consisting of foreclosures and REO’s (bank owned properties) at this point as short sales have fallen to the point to be statistically insignificant, accounted for just 6 percent of the overall home sales in the St Louis metro area, according to a report just released this morning by RealtyTrac. This is a decline of over 50 percent (56.3%) from a year ago when distressed home sales accounted for 13.7 percent of total home sales in St Louis.

St Louis county saw the biggest decline in the distressed home sales share of the market in the past year of the counties that make up the core of our St Louis real estate market and, as the table below shows, the city of St Louis saw the smallest decline and is the only one on the list where distressed home sales share of the market is in the double digits.

(We work hard on this and sure would appreciate a “Like”)

Search St Louis Homes For Sale HERE
See ALL Homes That Will Be Open In St Louis This Weekend
Continue reading “St Louis Distressed Home Sales Share Of Home Sale Market Declines Over 50 Percent

St Louis Foreclosure Activity In August Increases 140 Percent From Year Ago

St Louis Foreclosures in August decreased slightly from the month before (1.51%) however increased over 140% from August 2014, according to a report released today by RealtyTrac.  According to the report, there were 1,176 foreclosure filings in the St Louis metro area in August 2015 which equates to 1 in every 1,043 housing units in the metro area.

Below is a table showing foreclosure data for all of the counties that make up the St Louis metro area revealing Madison County Illinois had the highest rate of foreclosures in August at one in every 711 housing units followed by Saint Clair County Illinois at one in 811 housing units and then St Louis County Missouri at one in 964 units.

(We work hard on this and sure would appreciate a “Like”)

Search St Louis Foreclosures For Sale HERE

Search St Louis Homes For Sale HERE

Continue reading “St Louis Foreclosure Activity In August Increases 140 Percent From Year Ago

Underwater Homeowners in St Louis Continues To Decline

There were 123,546 St Louis homeowners with negative equity, or in a seriously underwater condition on their mortgage meaning they owe more than the current value of their home, in the St Louis MSA during the 2nd quarter of 2015 according to the most recent data by RealtyTrac. This works out to 17 percent of all St Louis metro area homeowners with a mortgage being underwater on their mortgage which is an improvement from 21 percent just 2 quarters prior.

As the table below shows, for the immediate St Louis, MO area, the city of St Louis had the highest rate of underwater homeowners at 1 out of every 4 homeowners with a mortgage and St Charles county had the lowest percentage at 7%.

(We work hard on this and sure would appreciate a “Like”)

Find your home’s market value online in LESS THAN A MINUTE!

Search all St Louis Homes For Sale HERE

Search St Louis Short Sales HERE

Continue reading “Underwater Homeowners in St Louis Continues To Decline

Three Missouri Counties At High Risk For Property Damage From Natural Disasters

It seems when we think of natural disasters and property damage, most people think of hurricanes and coastal areas which would be true and would certainly not apply to Missouri however, Missouri has threats to property from natural disasters as well. In fact, according to RealtyTrac’s annual U.S. Natural Disaster Housing Risk Report,  while Missouri does not have any counties that fall in the “Very High Risk” category when it comes to risk to housing from natural disasters, Missouri does have three counties that are in the “High Risk” category two of which, Jasper and Newton, are in the Joplin area in the southwest portion of the state and the third, Madison, is in the southeast area of Missouri.

In assessing the risk of property damage from natural disaster to counties, RealtyTrac looked at five natural disasters that pose a risk to housing: earthquake risk, hurricane risk, tornado risk, flood risk and wildfire risk. As the table below shows, risk of hurricanes and wildfires is pretty low in Missouri but we definitely have the other three threats here to varying degrees.  In the St Louis area, Jefferson County scored in the “Moderate Risk” category but the remaining counties in the “Low Risk” category.

(We work hard on this and sure would appreciate a “Like”)

Search St Louis Homes For Sale HERE
See ALL Homes That Will Be Open In St Louis This Weekend
5 Key Strategies To Assure A Quick Home Sale At The Maximum Price
Continue reading “Three Missouri Counties At High Risk For Property Damage From Natural Disasters

St Louis Foreclosure Activity Increases In July

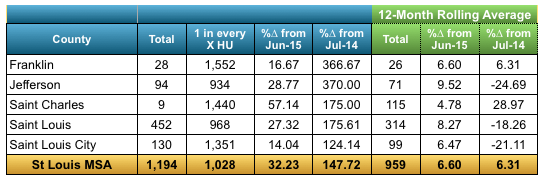
St Louis foreclosure activity increased in July 32.23 percent from the month before to 1,194 foreclosures actions in the St Louis metro area, or a rate of one foreclosure activity for every 1,028 homes, according to the latest data from RealtyTrac. As the table below shows, the foreclosure activity in July 2015 was up almost 150 percent from July 2014, however, when we look at the 12-month rolling average, we can see that the activity has risen about 6 percent from a year ago.

(We work hard on this and sure would appreciate a “Like”)

Search St Louis Foreclosures For Sale HERE

Search St Louis Homes For Sale HERE

St louis Foreclosure Activity July 2014 - July 2015

Copyright 2015 – All Rights Reserved – St Louis Real Estate News

The Ferguson Real Estate Market..one year later

One year ago today, the small city of Ferguson gained international attention after Ferguson Police Officer Darren Wilson shot and killed Michael Brown, an incident which spurred weeks of violence and property destruction in Ferguson.  This delivered a blow to the Ferguson real estate market which was, at the time, already struggling to recover from the housing bubble burst in 2008 which had severely impacted the area.   Now that a year has passed, I wanted to see how the real estate market in Ferguson was doing.


Time to sell a home is down…

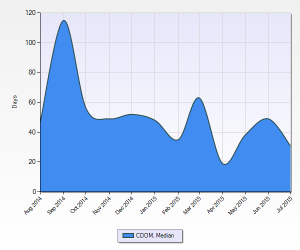
As the chart to the right shows, the median days on market for homes for sale in Ferguson shot up immediately after the shooting.  Since then the trend has been downward and last month the time had dropped back to slightly below a year ago.

Median days to sell a home in Ferguson

St Louis Property Flipping Down Nearly Fifty Percent In Past Year

St Louis property flipping activity rose during the 2nd quarter of this year 6.2 percent from the first quarter, however was down 44.3 percent from a year ago, according to information just released by RealtyTrac. During the 2nd quarter of this year, 3.2 percent of all home sales were “flips”, meaning they were purchased and then resold in an arms-length sale within 12 months. The average gross profit on the flipped property was $39,181 down for $50,870 a year ago.

(We work hard on this and sure would appreciate a “Like”)

Search St Louis Homes For Sale HERE
See ALL Homes That Will Be Open In St Louis This Weekend
Want to flip property? Check out my video on how to buy foreclosures here.
Continue reading “St Louis Property Flipping Down Nearly Fifty Percent In Past Year

St Louis Underwater Homeowners Rises Slightly-Equity Rich Owners Declines

The number of St Louis homeowners that are underwater, or have negative equity in their homes, has shown an upward trend lately, while those St Louis homeowners that are “equity rich” has trended downward.  According to data just released by RealtyTrac, 17.4 percent of homeowners in the St Louis metro area were seriously underwater (meaning their mortgage balance is 125% or more of the current value of their home) during the 2nd quarter of 2015.  This is showing a slight upward trend as, during the 4th quarter of 2014, just 17 percent were underwater.

As the table below shows, homeowners in the city of St Louis are in the worst shape, equity-wise with nearly one of every 4 (24.4%) housing units being seriously underwater St Charles County is in the best shape, of the counties in our core market, with just 7.4% of homeowners being seriously underwater.

(We work hard on this and sure would appreciate a “Like”)

Search St Louis Homes For Sale HERE
See ALL Homes That Will Be Open In St Louis This Weekend
5 Key Strategies To Assure A Quick Home Sale At The Maximum Price
Continue reading “St Louis Underwater Homeowners Rises Slightly-Equity Rich Owners Declines

St Louis Foreclosures Increase In First Half Of 2015

St Louis Foreclosures during the first half of 2015 increased in the St Louis metro area 26.52 percent from the second half of 2014 and 25.18 percent from the same period last year, according to a report released today by RealtyTrac.  According to the report, there were 5,468 foreclosure filings in the St Louis metro area during the first half of 2015 which equates to 1 in every 224 housing units in the metro area.

As the table below shows, with the exception of St Charles County, all of the counties making up the St Louis core market saw an increase in foreclosure activity in the first half of this year from the last half of last year.

(We work hard on this and sure would appreciate a “Like”)

Search St Louis Foreclosures For Sale HERE

Search St Louis Homes For Sale HERE

Continue reading “St Louis Foreclosures Increase In First Half Of 2015